List of free tools you can use to create cool Infographics, some can produce it in just seconds.
1. Wordle
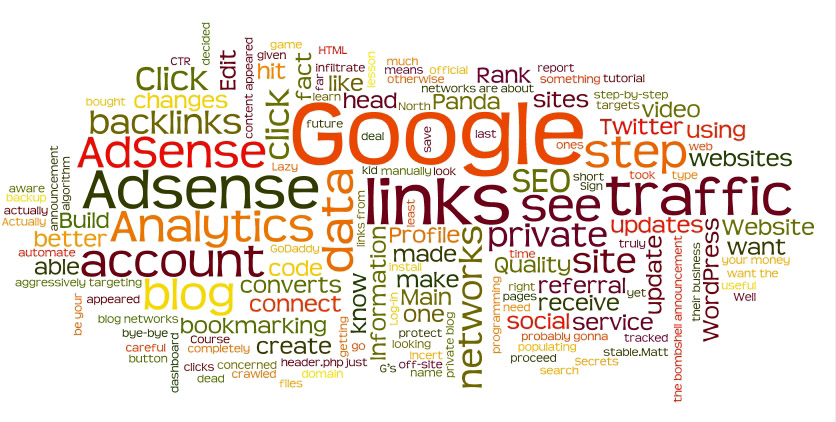
This tool is used to generate diagrams that display keyword density over the web. You can check out the graphics for moneyinternetblog.com here
2. Visual.Ly
Allows to create great Infographics based on your social activity on Facebook and Twitter. Currently it offers the following features.
- Life of a Hashtag infographics for Twitter hashtags in different designs: Broadsheet , Report, and Dossier
- Twitter Showdown in 4 different themes: Nimbus, Glow, Knockout, SXSW
- Facebook Monsterizer
- Twitterize Yourself
For example, in Twitter Showdown it compares two Twitter profiles together and creats Infographics within seconds. Hmmm… Let’s see how I am doing comparing to Patt Flynn from Smart Passive Income Not bad, ha ? lol ;-D
3. Chartle
Allows to create & publish charts online: diagrams, 3d charts, maps (world and US), gauges, O-meters, annotated timelines etc.
4. DIY Chart
Allows to create charts of any kinds. DIY (Do it yourself) Chart is a Web-based, simple and powerful online tool to create interactive charts and graphs from static or dynamic data which may be generated using any scripting language.
5. Google Chart Tools
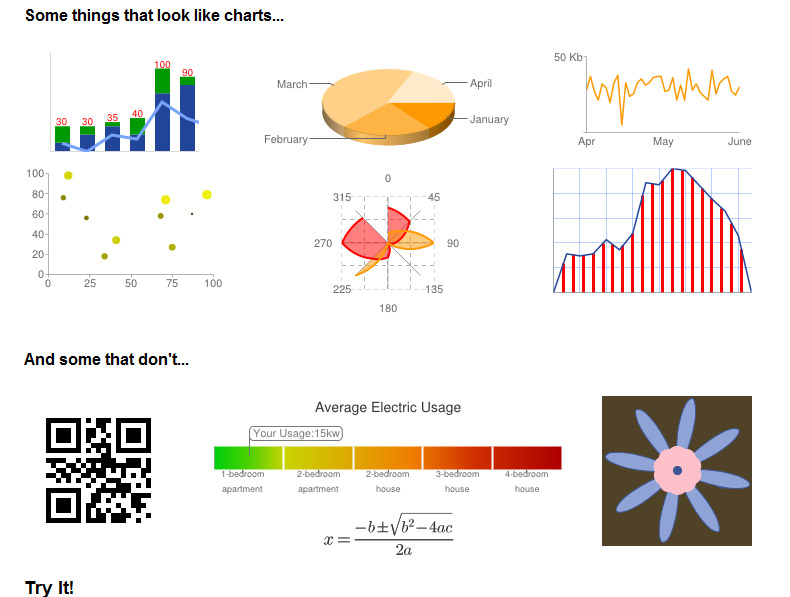
The Google Chart API lets you dynamically generate charts with a URL string. You can embed these charts on your web page, or download the image for local or offline use.
6. Piecolor
Piecolor allows to easily create 3D or 2D diagrams. The whole process is done online and interface is very user friendly.
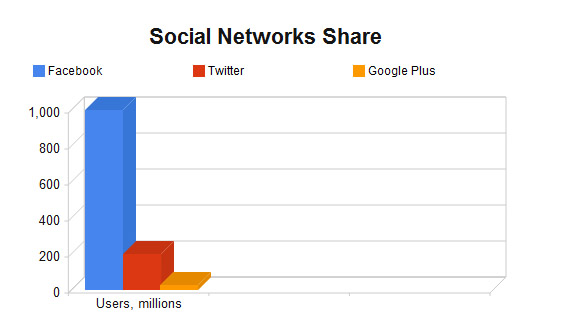
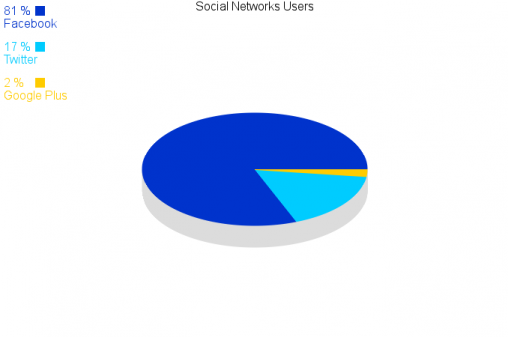
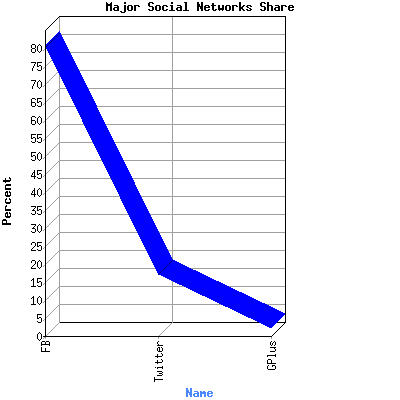
Check out the chart I’ve created. It is a diagram for social networking sites Facebook, Twitter and Google Plus share by their users.
7. Online Chart Generator
Free and very easy to generate, modify and save. So easy even 5th grader could do it.
8. OWTChart Generator
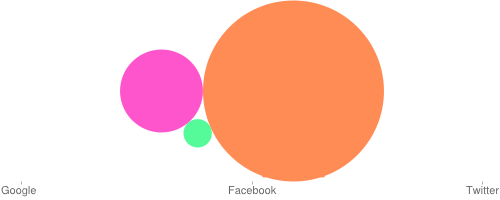
Another free tool to create charts and diagrams.
9. “What About Me” from Intel
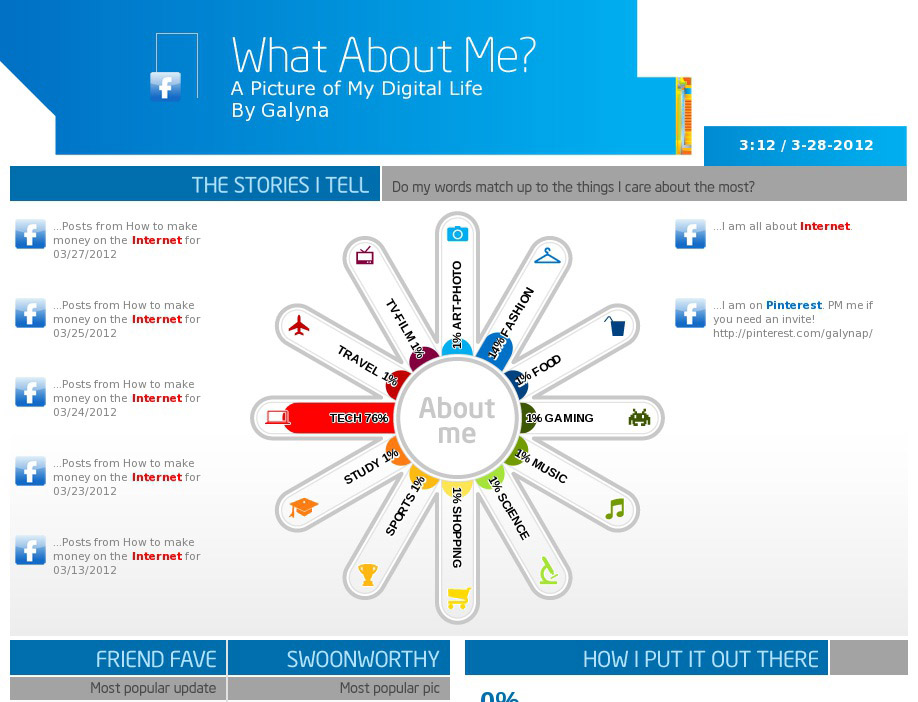
Collects info from your Facebook, Twitter and YouTube profiles to crank out a data visualization of your composite social media profile.
This tool is mostly for fun. However if you social networks are a brand, you can create pretty interesting infographics in just one click.




{ 0 comments… add one now }
Leave a Comment